These worksheets on how to draw bar charts will help the students of grade 1 understand the basics of bar charts and also help them visualize the graph. The student will be able to draw the bar charts by using the given data.
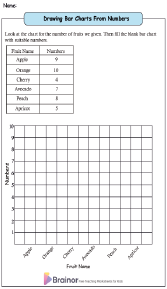
Drawing Bar Charts From Numbers
There are some data on fruits in a garden in a table. Students need to draw the bar charts according to the information.
Worksheet 1 Worksheet 2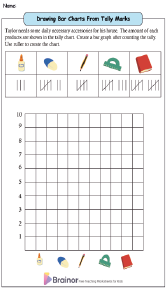
Drawing Bar Charts from Tally Mark Values
This worksheet contains the data which is represented as tally marks. Students need to count the tally marks and then plot the bar chart. This will also help them to understand the tally frequency.
Worksheet 1 Worksheet 2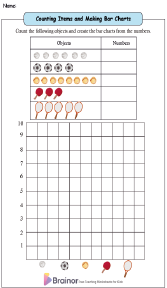
Counting Items and Creating Bar Charts
You need to count the objects from the given table. Write the exact numbers of the objects in the blank spaces. Use the data to draw a bar chart.
Worksheet 1 Worksheet 2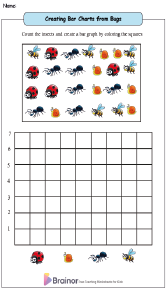
Create a Bar Chart by Counting Different Bugs
Count the bugs and note their number. Draw a bar chart in the given graph using this information.
Worksheet 1 Worksheet 2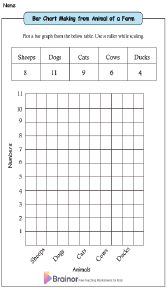
Create a Bar Chart by Counting Different Animals
Students need to plot and create a bar chart with the animal number data given in the table.
Worksheet 1 Worksheet 2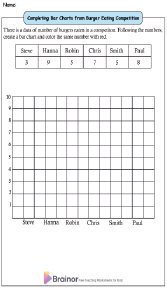
Completing a Bar Chart from a Burger Eating Competition
We have given data of the burger-eating competition. The numbers need to be converted into a bar chart.
Worksheet 1 Worksheet 2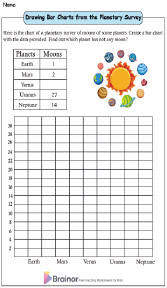
Drawing Bar Charts for a Planetary Survey
The data of the number of moons each planet of the solar system has is given in a table. You need to plot bar chart from the given data.
Worksheet 1 Worksheet 2